A simple 2d plot class for Android
March 5th, 2012
Download (The zip file contains plot2d.java in src\com\android\graphbutton)
Thomas Thron has modified my code to make it editable in an XML editor. He has also added some new functions to plot data more easily and to have it plotted logarithmically. His java file can be downloaded here.
My post about the files:
-----------------
I have added an Android tab to the site. A dynamic 2-D plot class can also be downloaded from there.
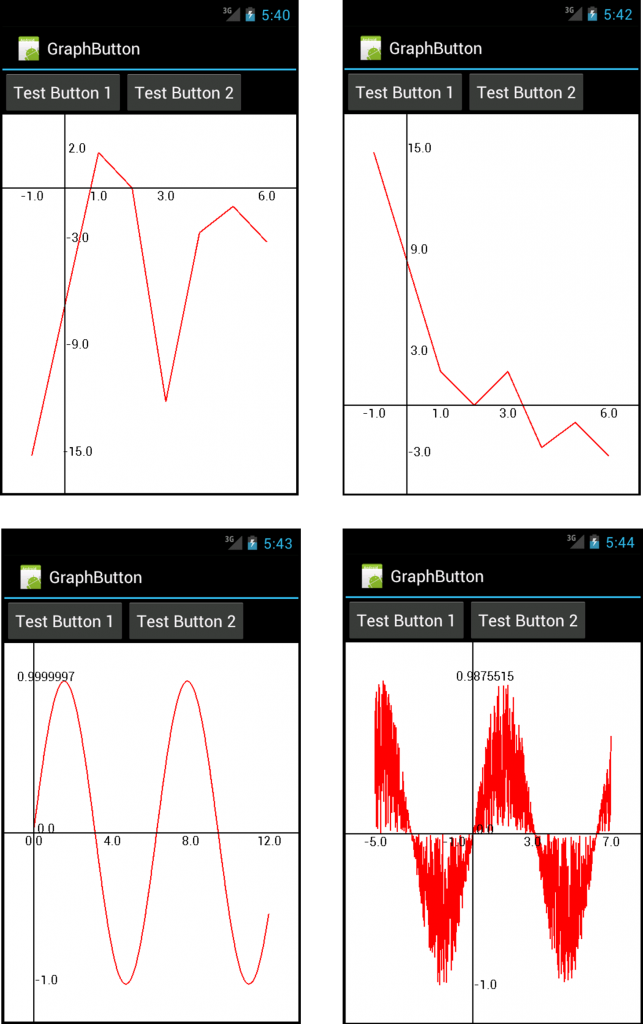
Since I have this awesome piece of gadgetry in my phone I decided to learn a little bit of Android application development. I initially just wanted to access the various sensors in the phone but having figured that out, I decided that it would be cool to do something with all the sensor data that I now had access to. As a first step I wanted to make a dynamic plot for the sensor readings, bundle it all up and release it as a free app in the app-jungle that is the Android Market. Having very minimal java experience I tried see if I can find a simple 2d plotting utility. I found a small number of solutions but some were too involved and the ones which were simple were just too ugly to look at. I thought that even with my beginner's knowledge of Android programming, I would still be able to make something functional and not too bad a looker. So I made plot2d. It's a simple Android java class which uses the Canvas class to display a 2-D plot between two float arrays on your Android phone. It automatically scales the plot for different screens and decides reasonable locations for the axes. It can automatically add the axes markers too. You can use it in your own code/app if you want to show a quick plot. Here are some results which were taken using the screenshots of the emulator:
Improvements can obviously be done but this serves my purpose for now. The code which generates the above examples can be downloaded here.

Hay ankit, you are working well but you should update your code , This code is not good as i accessed dude... No Zoom in Zoom out functions. Hay dude do something...
It's free, isn't it ?!
Nice example... I've been looking for an example that reads in data. I'm actually reading from a CSV file, but this gives me a good idea of how to do it. Thank You!
Nice example... I've been looking for an example that reads in data. I'm actually reading from a CSV file, but this gives me some idea of how to do it. Thank You!
Thanks! I'm glad this is of some use to you.
Really great help!!! Appreciate your help..
nice work.
Thanks, just what I needed to get a better understanding of plotting in Android.
Keep up the good work!
Very useful as a starting point.
I am using the code to do a polar chart
Thanks!!!
Thanks Andres. I'm glad it's of some help.
Thanks for sharing this example. Simple yet very enlightening.
This is an excellent example to drop in, start from, and modify on my first app, thanks so much!
Great example, thank you so much!
Excellent work, congratulations.
I have a doubt:
if i want to paint one or more points in a specific part of the graphic, ¿ What i do have to add in the code? and in what part?
thanks a lot.
Thanks,Great work buddy......it is really help full...
Great example, thank you so much!
Good job 🙂
Thank you soooo much man ,
i have been looking for simple example from a long time . thank you .
Awesome example.
HI Ankit,
now i am trying to draw graphs using Date on X Axis and data on Y Axis . Can you please help me regarding
What is the function of of test button 1 & 2 or are they just completely useless?
Nice Work. But why you insert two button with no action? And how is possible to change plot at onClickListner?