Download (The zip file contains plot2d.java in src\com\android\graphbutton)
Thomas Thron has modified my code to make it editable in an XML editor. He has also added some new functions to plot data more easily and to have it plotted logarithmically. His java file can be downloaded here.
My post about the files:
-----------------
I have added an Android tab to the site. A dynamic 2-D plot class can also be downloaded from there.
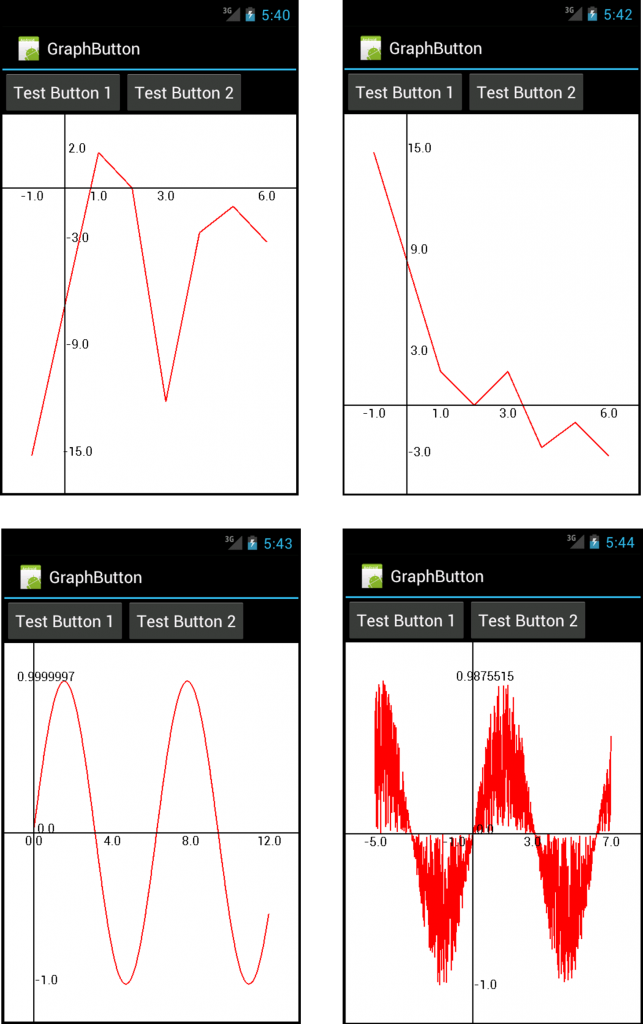
Since I have this awesome piece of gadgetry in my phone I decided to learn a little bit of Android application development. I initially just wanted to access the various sensors in the phone but having figured that out, I decided that it would be cool to do something with all the sensor data that I now had access to. As a first step I wanted to make a dynamic plot for the sensor readings, bundle it all up and release it as a free app in the app-jungle that is the Android Market. Having very minimal java experience I tried see if I can find a simple 2d plotting utility. I found a small number of solutions but some were too involved and the ones which were simple were just too ugly to look at. I thought that even with my beginner's knowledge of Android programming, I would still be able to make something functional and not too bad a looker. So I made plot2d. It's a simple Android java class which uses the Canvas class to display a 2-D plot between two float arrays on your Android phone. It automatically scales the plot for different screens and decides reasonable locations for the axes. It can automatically add the axes markers too. You can use it in your own code/app if you want to show a quick plot. Here are some results which were taken using the screenshots of the emulator:
Improvements can obviously be done but this serves my purpose for now. The code which generates the above examples can be downloaded here.
